
Losing 7 days in 4 seconds.
A journey into the mistakes I made that caused me to lose a large amount of work.

(Alternative title: The importance of infrastructure as code)
Hello everyone. I hope you're doing well. I'm writing this blog post to share with you a recent adventure I had, and something that helped reinforce my belief that you should aim to have everything defined as code (where possible).
Kubernetes is the hot new thing at the moment, and I am currently migrating my infrastructure off of docker and onto this behemoth of a system for a multitude of reasons. They're the typical K8S (Kubernetes) reasons, so I won't repeat them.
One of the most important to me though was abstraction. The abstraction that is given to the end-user makes things a lot easier to deploy, manage, upgrade and more. On the downside, when you don't do abstraction right, it can be a major kick in the teeth when things come crashing down.
I very recently lost roughly a week's worth of work in the space of 4 seconds. This blog post is going to discuss the mistakes I made, and hopefully, you can learn a few things from it.
The Seven days.
To give a bit of context, I've been running a mix of Kubernetes and Openshift clusters on my at-home server farm. My first (long term) deployment was K8s, the second was Openshift origin 4.4, and the most recent has been K8s. I call this iteration Apollo.
Apollo is special. It's been the cluster where I try to define my Kubernetes infrastructure as code and make monitoring and tracing a core feature in the cluster.
To manage the infrastructure as code (IaC), I was using a mixture of Helm and Kustomize. Helm allows for quick wins while deploying infrastructure as code, as you can deploy parameterized infrastructure, only changing the parameters as needed.
Kustomize requires you to deploy your entire infrastructure as code. No ifs, no buts. You want a secret, you create the YAML.
My first mistake was using a mixture of configuration management tools. It leads to fragmentation of my codebase, and as a result, maintaining quality was a little harder. When you are aiming to maintain and improve quality, try to stick to a minimal codebase. This scales with team size, so find whatever is appropriate for your team and stick with it.
Once the cluster was lovingly deployed with Ansible, I began investigating how I could monitor the state of the cluster. Having a view over the state of your environment is paramount to quality, and so any QA should push for good dashboarding and monitoring as a core component. With monitoring, you understand the health of your environment better. You recognise the weaknesses, the bottlenecks, the defects.
Dashboards give you an understanding of the state of the system as a whole and give you visibility into where you need to test.
Within the K8S realm, Prometheus is one of the most popular monitoring tools at the moment. Combine that with a graphing tool like Grafana, and you've got a killer combo.
I used Helm to deploy the Prometheus operator, which deployed Prometheus, Grafana and a few other components into your cluster. I saved the variables I used to deploy initially so that I could redeploy the infrastructure again, and again, and get repeatable results.
The Prometheus operator configures some Grafana dashboards by default, giving some great insight into the health of a Kubernetes cluster.
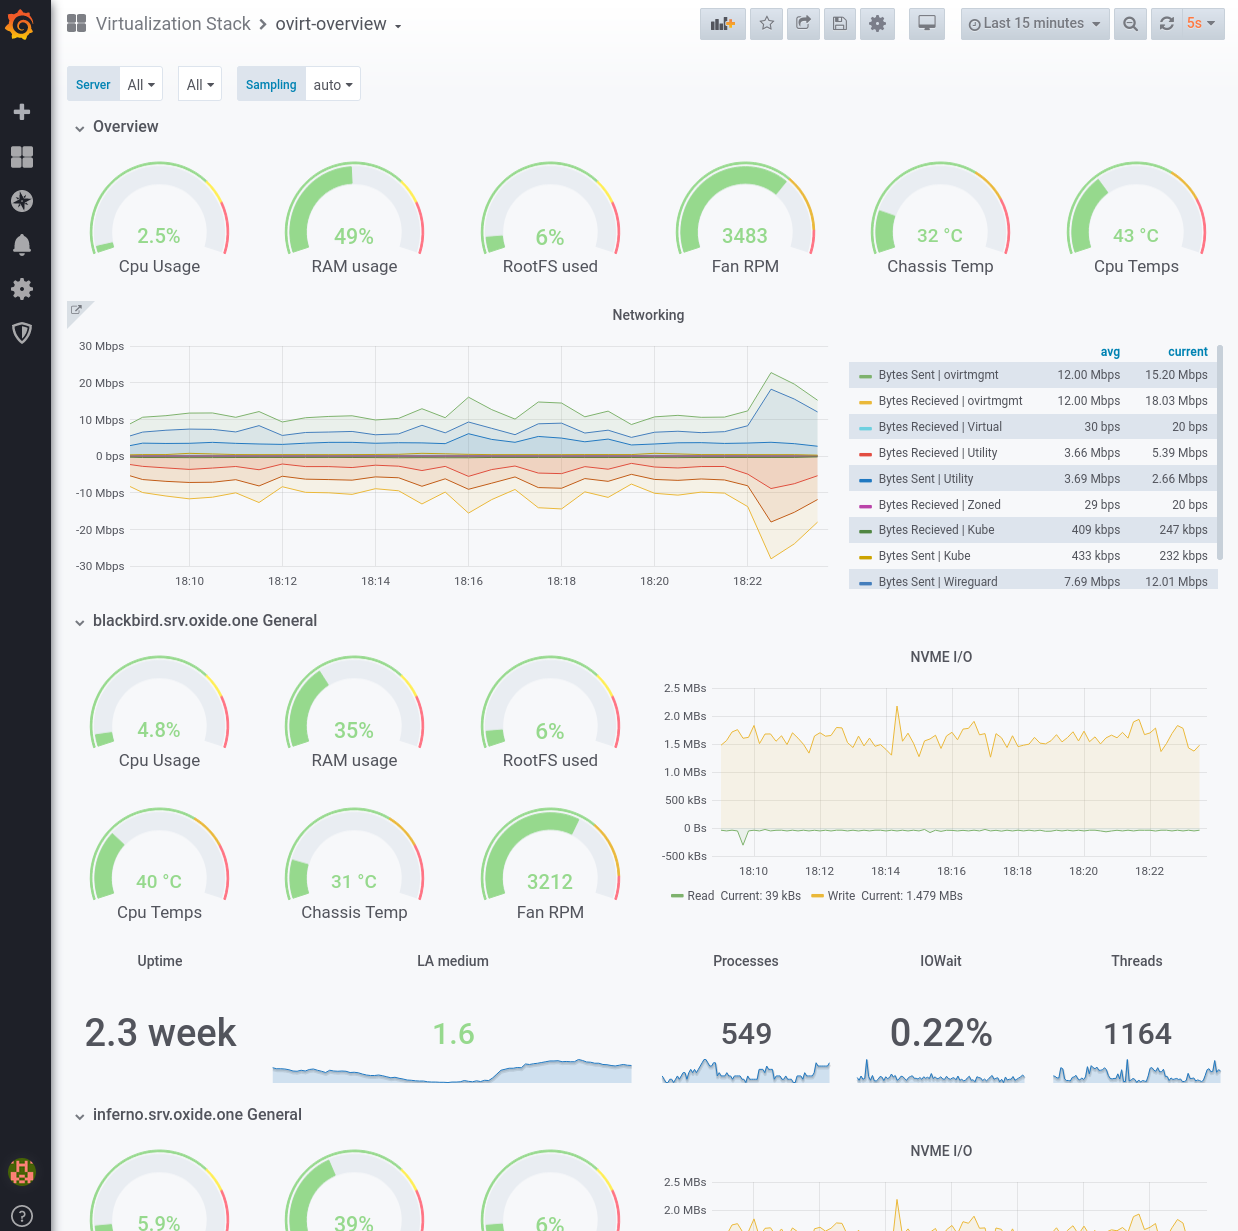
Once there, I logged into Grafana and began building some extra dashboards by hand. I wrote one to monitor the health of my Hypervisor cluster.
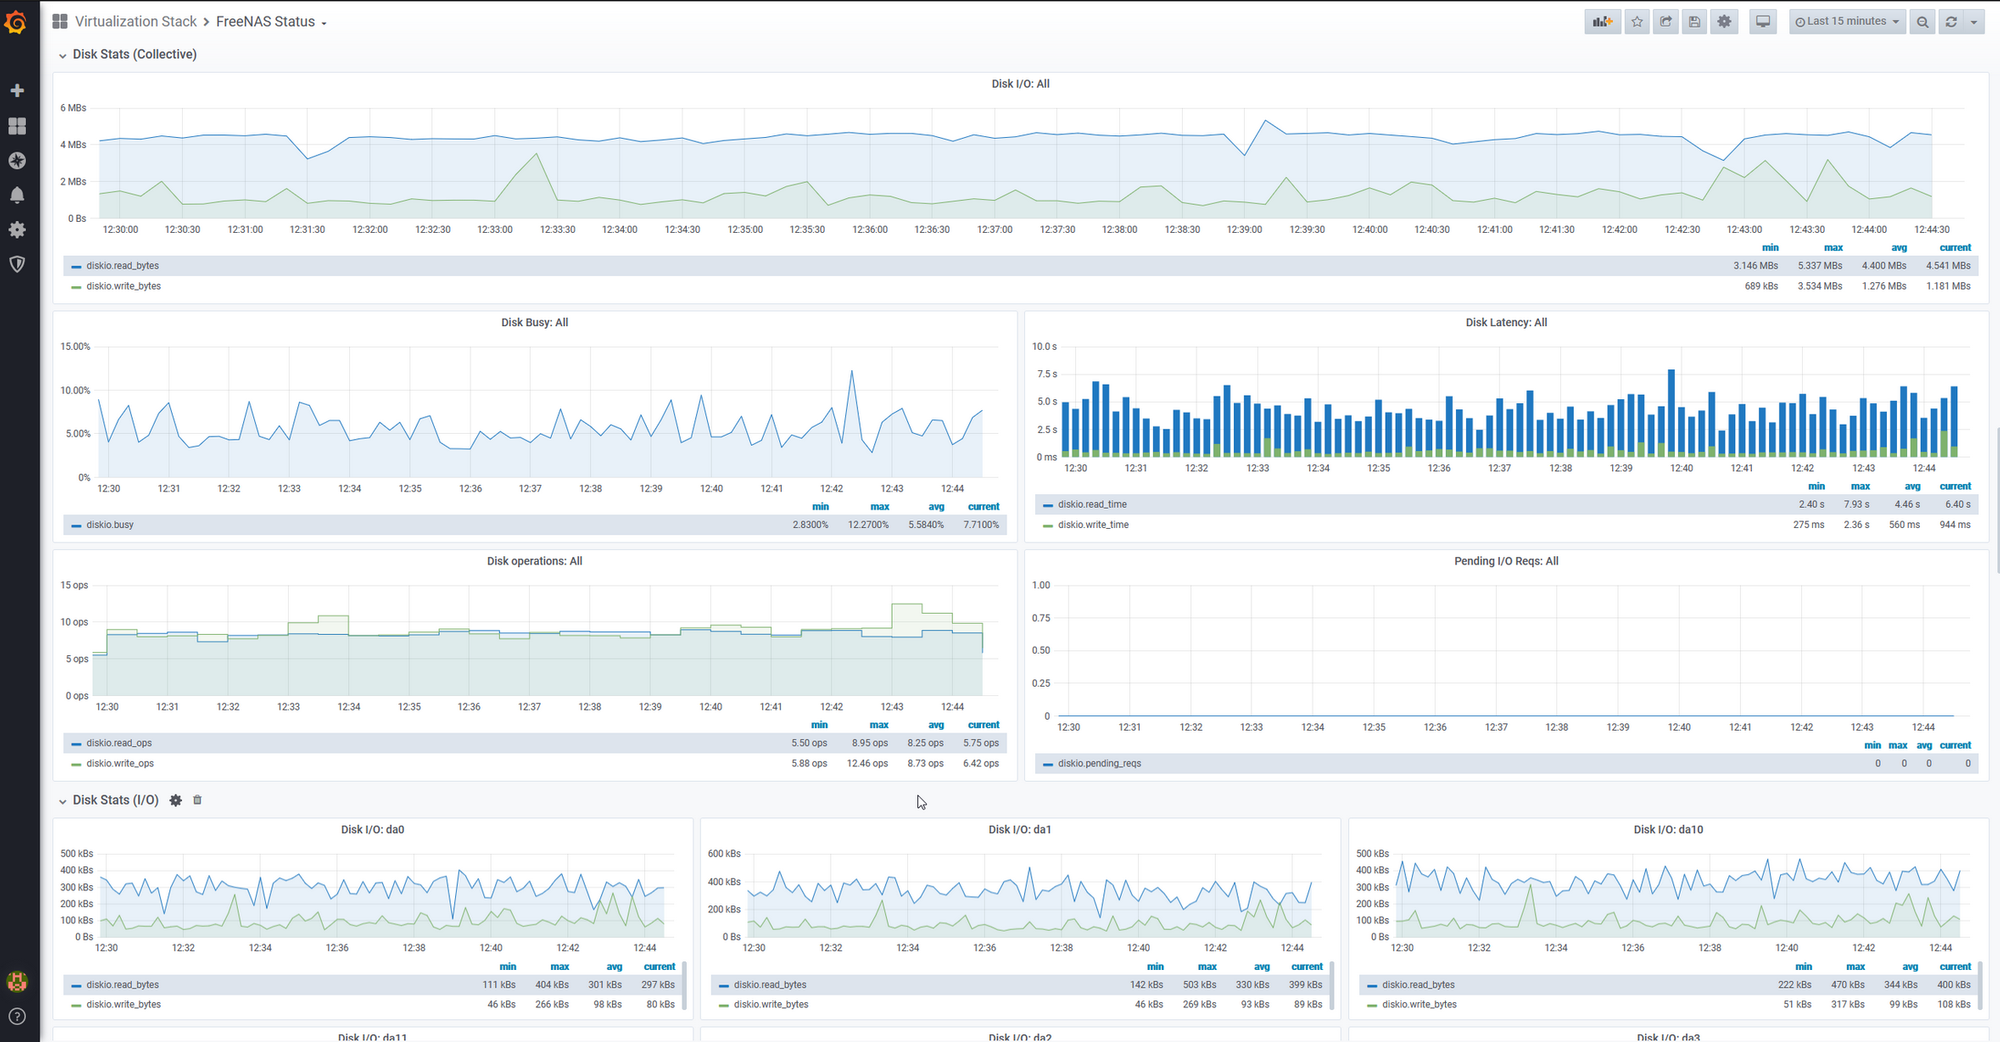
From there, I continued building and wrote one to Monitor the heatlh of my FreeNAS system.

These manual changes provided me with even greater visibility of the health of my entire system, not just Kubernetes. I began to understand some of the defects within my system in a much better way.
One example of this was learning that I had a high level of queued IO requests on FreeNAS. This was causing performance issues and as a result, was causing timeouts on components reliant on FreeNAS. I had discovered a defect through the use of monitoring, was able to trace the cause back to queued IO, and fix it with creating a cache device.
Making the manual changes and creating dashboards proved to be undoubtedly useful. Although, with these manual changes lies my next mistake. Manual changes. I made the mistake of manually creating dashboards onto an automatic deployment. If I were to redeploy the Prometheus operator, I would lose all of these manual changes, and my dashboards.
I spent about a week creating these dashboards, working into the evening to get them configured to how I liked them.
I defined most of my infrastructure as code. Not all of it. (Foreshadowing a little bit here).
Four seconds.
Four seconds is all it took to bring it all crashing down.
I had built up my dashboards to a point where I wanted to experiment with alerting me when issues are found. Stuff like CPU temperatures spiking above 80°C for more than a few minutes. I want to be able to act quickly when an issue is found and resolve it. To do this, I wanted to configure Grafana to send me an email when an alert is triggered.
To do this, I went to my private repo, modified the helm values to set an email server and its credentials, and updated the deployment. I had assumed that the dashboards were saved into backing storage (like I would have done with Kustomize), and so updating the deployment would just load the dashboards again once it rolls out.
I pressed enter and 4 seconds later, I was notified that the deployment had completed successfully. I opened up the Grafana dashboard and was presented with a login screen.
Odd. I don't usually need to login to Grafana as I had a session token.
I logged in and noticed that the theme had changed back to the default (dark mode).
This is where my mind begins to panic.
I take a look at the dashboard list and realise they're all there; except for the ones I had created myself. The 10 minutes setting up the operator was there, but the 7 days making my dashboards were gone. S**t.
Unbeknownst to me, Helm had redeployed the entire operator. Meaning it wiped the slate clean and treated it like it was a completely new deployment. I had misunderstood the helm chart and assumed that it saved the configuration into storage, resulting in an iterative deployment.
This is my third mistake. Using tools I do not understand properly. Whether this is a misunderstanding of Helm, Kubernetes or something else; there is still a misunderstanding made.
The takeaway from all this.
So. I made a few mistakes. Let's cover them in a bit more depth so that you can recognise them in your team, and prevent them from happening.
Multiple tools for the same purpose
The first mistake I made was the use of multiple tools to perform the same task. While I'm not saying you should use one tool for everything, you should not aim to use multiple tools that do the same thing. An example of this would be using Ansible and Puppet. They are both configuration management tools. Unless you are doing something highly specialised that requires the use of multiple tools, try to stick to one. This helps prevent knowledge of one leaking into the other and causing confusion and mistakes. In my case, I had assumed that the helm chart created storage for the Graphana dashboards (allowing them to persist) like I would have done for Kustomize.
90% IaC is not acceptable.
The next mistake was manual changes ontop of automated changes. I had defined 90% of my infrastructure as code, but the remaining 10% was what mattered the most.
The 10% in my case, was the custom dashboards I had created. For others, 10% could be code pipelines to deploy code. This kind of infrastructure is often easy to create, and incredibly hard to spot. Sometimes you make assumptions that the remaining 10% is not that important, but you won't realise that until it's gone. I'm not going to claim I'm a master at this by any stretch, but I'll try and give some tips on recognising it.
The first steps to recognising the hidden 10% are to deploy your infrastructure into a test environment with only the parts that are defined as code and compare it to what is actually deployed. This will give you a start into recognising what work needs to be done, and do not stop until you reach 100% and can prove it is 100%.
For some cases, 100% is not possible, and that can be ok. Mitigate against it by documenting the manual changes needed, and make sure that you can prove it.
Understand the tools you are using
This links back to my first mistake somewhat. But it is important to understand the infrastructure tools you are using. I'm not saying that you need to be the all-seeing guru of all things helm, but you should at least build up an understanding that allows you to do the most common tasks without needing to consult a guide. If the tool you are working with does something you did not expect, investigate why that happened and learn from it. Tools are not people, they will always do what you tell them to do. Do not sit idly and just think "oh nothing will come of that", because it can.
Next steps
Where do I go from here? I'm going to drop helm. It's great for some quick and small wins, but I do not want to be in a position where I am not in control of what I am deploying, and cause an issue like this again.
I'm probably going to wait for Openshift origin 4.4 to release (officially), and give it another go. Maybe I'll call this one Skylab. All I know is that from here I can only learn, and I hope you learnt something from this adventure too.